|
|
Published May 2025*
| Location: |
SACRAMENTO COUNTY, YOLO COUNTY |
| Price Range: |
$0 - No Limit |
| SQFT Range: |
0 - No Limit |
| Property Types: |
All Residential Prop - All Properties - All Properties - All Lot Sizes - Exclude Sold Off MLS |
| Bedrooms: |
0 - No Limit |
| Full Baths: |
0 - No Limit |
| Half Baths: |
0 - No Limit |
| Year Built: |
0 - No Limit |
|
Prepared for you by: Marc DeContreaus
|
|
Number of Homes For Sale vs. Sold vs. Pended - Mar. 2024 - May. 2025 (Preliminary)
|
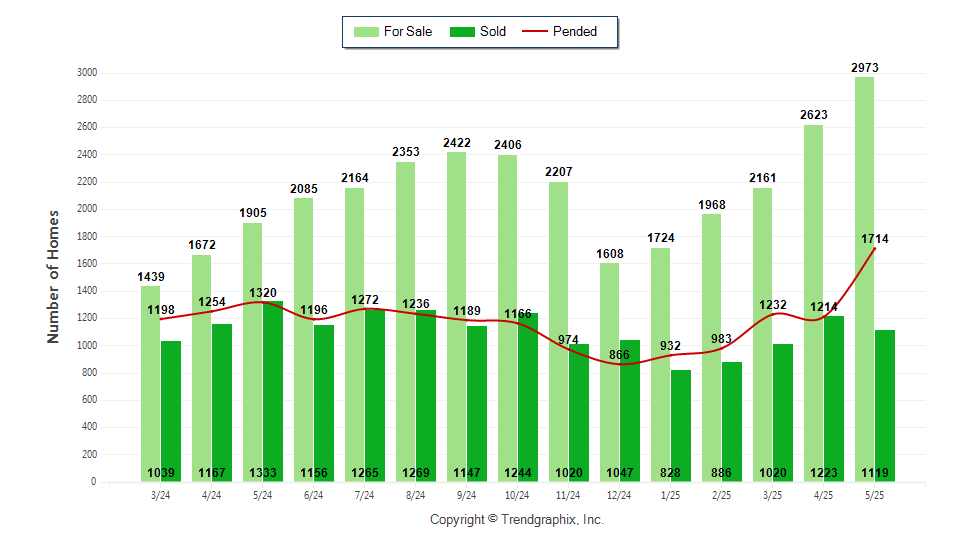
| Curnt vs. Prev Month | Curnt vs. Same Month 1 Yr Ago | Curnt vs. Same Qtr 1 Yr Ago | | May. 25 | Apr. 25 | % Change | May. 25 | May. 24 | % Change | Mar. 25 to May. 25 | Mar. 24 to May. 24 | % Change | | For Sale | 2,973 | 2,623 | 13.3%  | 2,973 | 1,905 | 56.1% | 2,973 | 1,905 | 56.1% | | Sold | 1,119 | 1,223 | -8.5%  | 1,119 | 1,333 | -16.1% | 3,362 | 3,539 | -5% | | Pended | 1,714 | 1,214 | 41.2% | 1,714 | 1,320 | 29.8% | 4,160 | 3,772 | 10.3% |
| TODAY’S STATS | | Current vs. Prev MTD | Current vs. Same MTD 1 Yr Ago | Current vs. Prev YTD | | 6/1/25 - 6/1/25 | 5/1/25 - 5/1/25 | % Change | 6/1/25 - 6/1/25 | 6/1/24 - 6/1/24 | % Change | 1/1/25 - 6/1/25 | 1/1/24 - 6/1/24 | % Change | | For Sale | 2,944 | 2,699 | 9.1% | 2,944 | 2,085 | 41.2% | 2,944 | 2,085 | 41.2% | | Sold | 0 | 42 | -100% | 0 | 0 | N/A | 5,077 | 5,244 | -3.2% | | Pended | 18 | 74 | -75.7% | 18 | 19 | -5.3% | 6,086 | 5,703 | 6.7% |
|
|
Avg Days On Market & SP/Orig LP % - Mar. 2024 - May. 2025 (Preliminary)
|
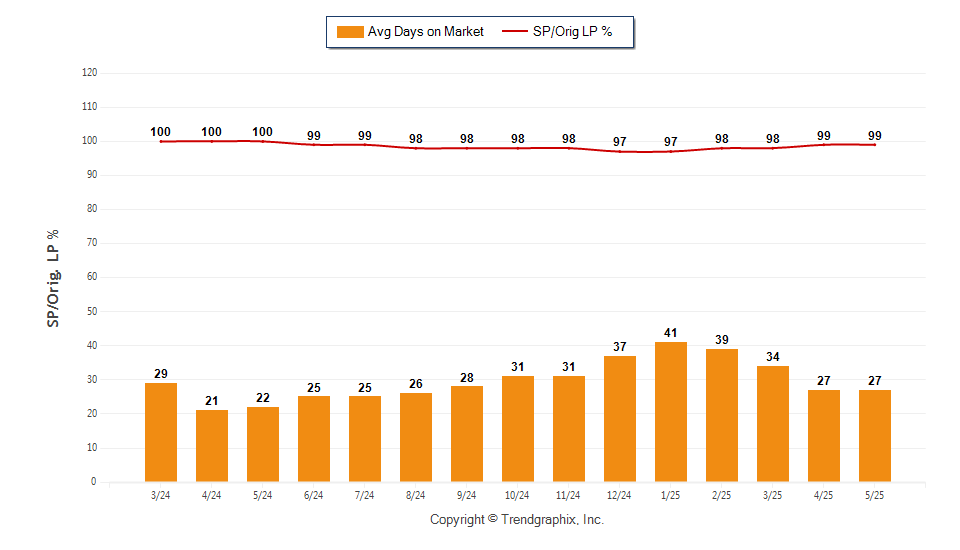
| Curnt vs. Prev Month | Curnt vs. Same Month 1 Yr Ago | Curnt vs. Same Qtr 1 Yr Ago | | May. 25 | Apr. 25 | % Change | May. 25 | May. 24 | % Change | Mar. 25 to May. 25 | Mar. 24 to May. 24 | % Change | | Avg Days on Market | 27 | 27 | 0% | 27 | 22 | 22.7% | 29 | 24 | 20.8% | | Sold/Orig LP Diff. % | 99 | 99 | 0% | 99 | 100 | -1% | 99 | 100 | -1% |
| TODAY’S STATS | | Current vs. Prev MTD | Current vs. Same MTD 1 Yr Ago | Current vs. Prev YTD | | 6/1/25 - 6/1/25 | 5/1/25 - 5/1/25 | % Change | 6/1/25 - 6/1/25 | 6/1/24 - 6/1/24 | % Change | 1/1/25 - 6/1/25 | 1/1/24 - 6/1/24 | % Change | | Avg Days on Market | 0 | 34 | -100% | 0 | 0 | N/A | 33 | 28 | 17.9% | | Sold/Orig LP Diff. % | 0 | 100 | -100% | 0 | 0 | N/A | 98 | 100 | -2% |
|
|
Months of Inventory Based on Closed Sales - Mar. 2024 - May. 2025 (Preliminary)
|
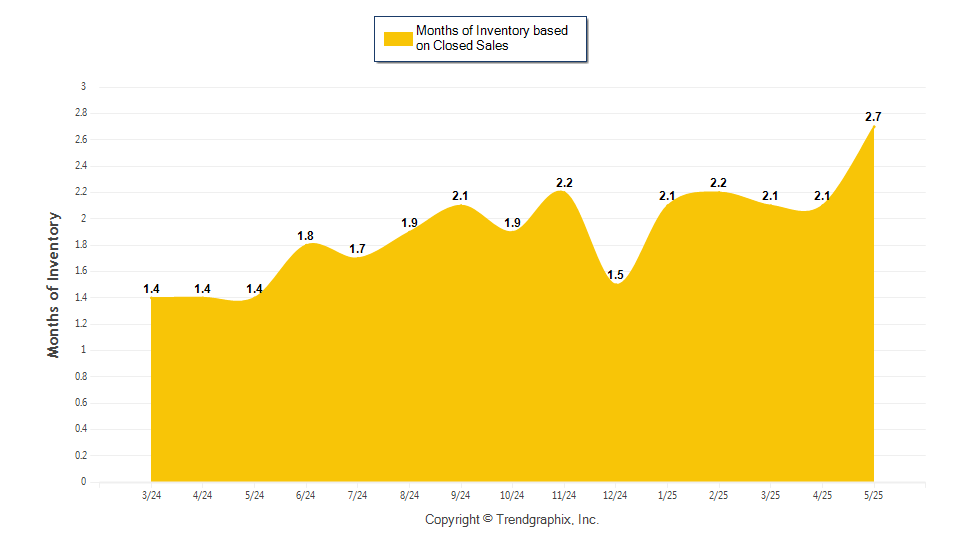
| Curnt vs. Prev Month | Curnt vs. Same Month 1 Yr Ago | Curnt vs. Same Qtr 1 Yr Ago | | May. 25 | Apr. 25 | % Change | May. 25 | May. 24 | % Change | Mar. 25 to May. 25 | Mar. 24 to May. 24 | % Change | | Months of Inventory (Closed Sales) | 2.7 | 2.1 | 28% | 2.7 | 1.4 | 91% | 2.7 | 1.6 | 68.1% |
| TODAY’S STATS | | Current vs. Prev MTD | Current vs. Same MTD 1 Yr Ago | Current vs. Prev YTD | | 6/1/25 - 6/1/25 | 5/1/25 - 5/1/25 | % Change | 6/1/25 - 6/1/25 | 6/1/24 - 6/1/24 | % Change | 1/1/25 - 6/1/25 | 1/1/24 - 6/1/24 | % Change | | Months of Inventory (Closed Sales) | 0 | 2.1 | -101.3% | 0 | 0 | N/A | 2.9 | 2 | 44.7% |
|
| Date | 3/24 | 4/24 | 5/24 | 6/24 | 7/24 | 8/24 | 9/24 | 10/24 | 11/24 | 12/24 | 1/25 | 2/25 | 3/25 | 4/25 | 5/25 | | For Sale | 1,439 | 1,672 | 1,905 | 2,085 | 2,164 | 2,353 | 2,422 | 2,406 | 2,207 | 1,608 | 1,724 | 1,968 | 2,161 | 2,623 | 2,973 | | New Listing | 1,597 | 1,709 | 1,832 | 1,669 | 1,739 | 1,759 | 1,634 | 1,550 | 1,093 | 730 | 1,450 | 1,458 | 1,808 | 1,996 | 1,824 | | Sold | 1,039 | 1,167 | 1,333 | 1,156 | 1,265 | 1,269 | 1,147 | 1,244 | 1,020 | 1,047 | 828 | 886 | 1,020 | 1,223 | 1,119 | | Pended | 1,198 | 1,254 | 1,320 | 1,196 | 1,272 | 1,236 | 1,189 | 1,166 | 974 | 866 | 932 | 983 | 1,232 | 1,214 | 1,714 | | Months of Inventory (Closed Sales) | 1.4 | 1.4 | 1.4 | 1.8 | 1.7 | 1.9 | 2.1 | 1.9 | 2.2 | 1.5 | 2.1 | 2.2 | 2.1 | 2.1 | 2.7 | | Months of Inventory (Pended Sales) | 1.2 | 1.3 | 1.4 | 1.7 | 1.7 | 1.9 | 2 | 2.1 | 2.3 | 1.9 | 1.8 | 2 | 1.8 | 2.2 | 1.7 | | Absorption Rate (Closed Sales) % | 72.2 | 69.8 | 70 | 55.4 | 58.5 | 53.9 | 47.4 | 51.7 | 46.2 | 65.1 | 48 | 45 | 47.2 | 46.6 | 37.6 | | Absorption Rate (Pended Sales) % | 83.3 | 75 | 69.3 | 57.4 | 58.8 | 52.5 | 49.1 | 48.5 | 44.1 | 53.9 | 54.1 | 49.9 | 57 | 46.3 | 57.7 | | Avg. Active Price | 749 | 735 | 729 | 721 | 704 | 684 | 673 | 675 | 661 | 678 | 656 | 650 | 666 | 686 | 683 | | Avg. Sold Price | 583 | 585 | 614 | 603 | 605 | 599 | 595 | 585 | 589 | 586 | 583 | 580 | 607 | 599 | 605 | | Avg. Sq. Ft. Price (Sold) | 343 | 340 | 352 | 345 | 346 | 341 | 340 | 340 | 337 | 332 | 337 | 340 | 340 | 347 | 352 | | Sold/List Diff. % | 101 | 101 | 101 | 100 | 100 | 100 | 100 | 100 | 100 | 99 | 99 | 99 | 100 | 100 | 100 | | Sold/Orig LP Diff. % | 100 | 100 | 100 | 99 | 99 | 98 | 98 | 98 | 98 | 97 | 97 | 98 | 98 | 99 | 99 | | Avg Days on Market | 29 | 21 | 22 | 25 | 25 | 26 | 28 | 31 | 31 | 37 | 41 | 39 | 34 | 27 | 27 | | Median Active Price | 599 | 600 | 600 | 600 | 599 | 590 | 580 | 575 | 569 | 580 | 575 | 575 | 579 | 589 | 580 | | Median Sold Price | 540 | 538 | 550 | 550 | 545 | 541 | 550 | 539 | 535 | 535 | 528 | 539 | 550 | 540 | 545 |
|
|
If your email program is not displaying the chart graphs properly, please click on the following link which will take you to a web page that contains the graphs: Show Chart
*All reports are published May 2025, based on data available at the end of April 2025, except for the today’s stats. All reports presented are based on data supplied by BAREIS MLS. Neither the Association nor its MLS guarantees or is in anyway responsible for its accuracy. Data maintained by the Association or its MLS may not reflect all real estate activities in the market. Information deemed reliable but not guaranteed.
|
|
|
|